The “African Peace Processes (APP)” dataset covers peacemaking efforts in armed conflicts in Africa over the 1989–2019 period. Specifically, the APP dataset identifies rounds of peace negotiations in armed conflicts listed by the Uppsala Conflict Database Program (UCDP). Overall, the data cover more than 2,600 individual peace-negotiation rounds across armed conflicts in Africa. For each negotiation round, the APP dataset lists the start and end dates, and provides information on the negotiation’s outcome as well as on any third party involved as a mediator.
Existing data collections of this kind either (1) focus only on ‘active’ conflict years, in which more than a pre-defined number of battle deaths have taken place; (2) ignore peacemaking efforts in non-state conflicts, in which no state forces were involved; or (3) record peace efforts at only a coarse, annual level. By contrast, the APP dataset (1) includes observations on peacemaking efforts in active and inactive conflicts, as well as (2) in inter-state, intra-state, and non-state conflicts. Moreover, observations in the APP dataset (3) are recorded at both the annual and monthly level. As a result, the APP dataset allows scholars to study the impact of mediation on African armed conflicts across a broader range of conflict settings and with greater temporal disaggregation than has hitherto been possible.
Another advantage of the APP dataset is its accompanying ‘peacemaking encyclopedia’. This term refers to an extensive collection of written analytical summaries that provide further details on the onset, process, and outcomes of all negotiation rounds observed in African armed conflicts. The encyclopedia currently runs to about 1,000 pages in length. It will eventually also contain input provided by experts who work in the respective conflict zones, thereby combining insights from scholarship and peace practice.
The analytical summaries of the negotiations and mediation efforts can be downloaded here.
Financial support for the coding effort was provided by the Center for Security Studies (CSS) at ETH Zurich and by the Folke Bernadotte Academy (FBA).
Graphical overview
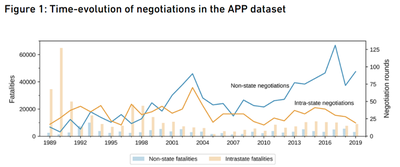
Figures 1 & 2 provide an overview of the APP dataset for intra-state and non-state conflicts. Data on peace efforts in inter-state conflicts is not visualized below since this conflict type was rare in the 1989–2019 period and has led to comparatively few negotiation rounds.
The two annotated lines in Figure 1 below show the number of negotiation rounds that started in a given year, as recorded in the APP dataset (right y-axis). Vertical bars show the number of battle-related fatalities in a given year, as recorded by the UCDP for African countries (left y-axis). The plot illustrates that the APP dataset records more rounds of negotiations in intra-state conflicts than in non-state conflicts up until 1993, but fairly similar values are recorded until 2000. From 2001 onwards, the APP dataset records more rounds of negotiations in non-state conflicts. This cannot be explained by the relative prevalence of each type of conflict, as the UCDP almost always records more battle-related deaths in intra-state conflicts. Instead, the consistent gap between the number of negotiations in each type of conflicts is in line with observations made by scholars and practitioners about how peace efforts in ‘local’, non-state conflicts have increased.
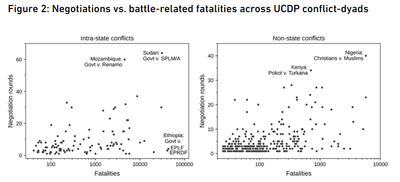
The black dots in the two scatterplots in Figure 2 below denote UCDP conflict-dyads for which the APP dataset records at least one negotiation round. For each such conflict-dyad, the two scatterplots then graph the total number of recorded negotiation rounds (y-axis) against the total number of battle-related fatalities (x-axis, on a log-10 scale), with fatality data being taken from the UCDP. In-plate annotations highlight six specific conflict-dyads for illustrative purposes. Particularly striking are the two conflict-dyads involving the Ethiopian government (bottom of the left plate). As can be seen, peace negotiations have been infrequent here, despite the very high of number fatalities involved. Overall, the two scatterplots illustrate that even when armed conflicts score similarly on a common metric of intensity, the parties involved may still differ widely in their observed negotiating behavior.
Allard Duursma
Assistant Professor
My research interests include mediation, peacekeeping and the links between patronage politics and political order.